As part of a current project with Calvin Isch and Richard Brown, I’ve been looking at the Global Burden of Disease project’s Summary Exposure Values (SEVs). The SEV is a really useful measure for us, because we’re interested in the extent to which people’s perceptions of risk are associated with objective measures of exposure to health risks. Luckily, the Global Burden of Disease project have done some incredibly detailed work to try to quantify exposures to certain risks.
The GBD describe the SEV as follows:
“A measure of a population’s exposure to a risk factor that takes into account the extent of exposure by risk level and the severity of that risk’s contribution to disease burden. SEV takes the value zero when no excess risk for a population exists and the value one when the population is at the highest level of risk; we report SEV on a scale from 0% to 100% to emphasize that it is risk-weighted prevalence.”
I would recommend this excellent Lancet paper for more details on the construction of this measure.
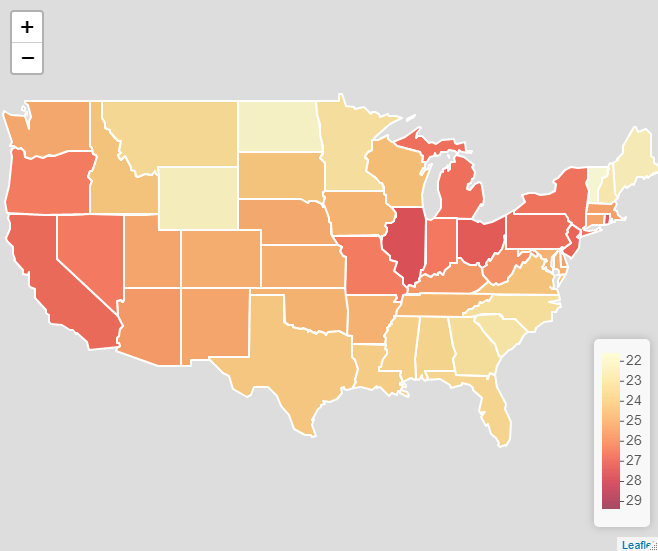
Since I’m particularly interested in perceptions about uncontrollable mortality risks (risk exposures which are not impacted by individual behaviour), I’ve been using the SEV values for environmental and occupational risks, which is a combined index of those risks not classified by the GBD project as being related to behaviour (see https://ghdx.healthdata.org/ for more on the data).
This all seemed like an excellent excuse to make a new map, this time using Leaflet, an excellent R package, which allows you to create and customise interactive web maps without knowing any JavaScript. Here’s the resulting map. To see the interactive version, please click on the image link and view the map in RPubs, as WordPress won’t allow me to embed it using an iframe.