In the process of producing a recent meta-analysis on telomeres as markers of exposure to stress and adversity, we needed to convert various effect types (e.g. standardised betas, F-ratios and T-statistics) to correlation coefficients, ready to be meta-analysed. The script is fairly straightforward, but it took a little while to write the script and format the data entry to work smoothly with the script. So, to save others some time and energy, I’ve made a generic version of the script, along with a template input file–just to make things easy to use. You can download the files here, along with a guide on how to correctly enter your data into the template input file, so that the correlation converter script can read it.
Quick-start guide:
1. Enter your data into this template csv, using the table in this document as a guide.
2. Make sure the template csv is in the same folder as this R script.
3. Run the script in R. If you don’t have R, you can learn more and download it here.
4. Once you’ve run the script, a new file, entitled “MetaAnalyisCommonAssociations.csv” should appear in the same folder. It should contain all the data in your original csv, plus two new columns containing the “CommonEffect” (the correlation coefficient) and the “CommonEffectVariance” (the measure of variance).
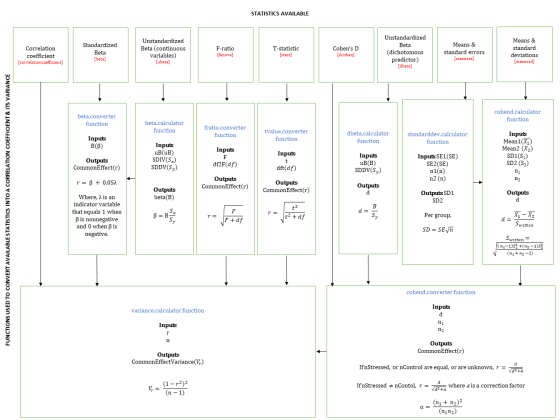
What is the script doing? The script contains comments explaining what each piece of code does, but for those who find diagrams and equations easier to follow, this flow chart shows the operations it performs: